Introduction
Combustion of fossil fuels results in emission of carbon dioxide (CO2) thereby increasing its levels in the atmosphere. Burning of fossil fuels also results in carbon monoxide (CO), nitrous oxide (N2O), sulfur dioxide (SO2), nitrogen oxide (NOx) emissions, and particulate matter which leads to air pollution and causes harmful effects on human health. Industrial-scale CO2 emissions from the burning of fossil fuels started around 1750.
Atmospheric CO2 levels
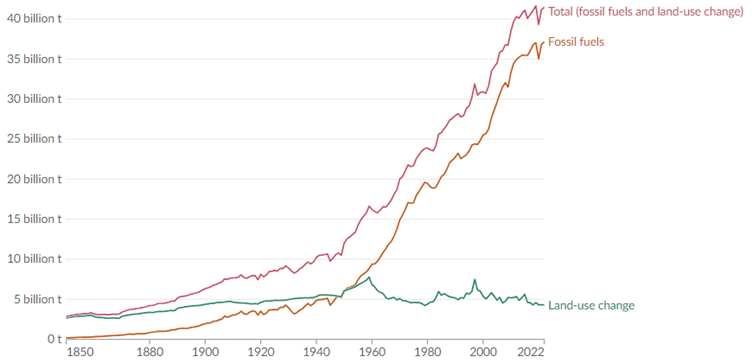
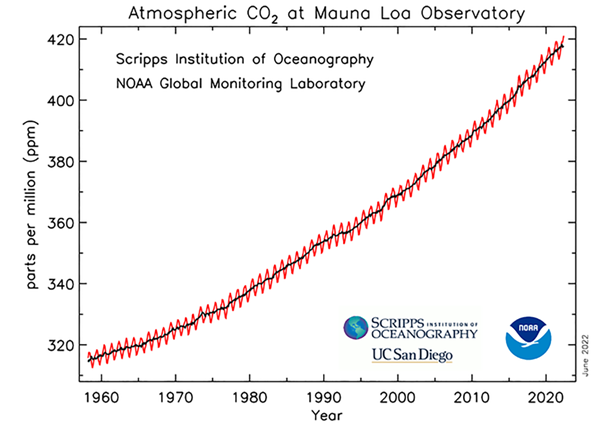
Currently, CO2 levels are at 420 ppm [1] with an annual growth rate of 2 ppm [2]. Before the industrial revolution, the CO2 levels in the atmosphere were consistently around 280 ppm for the past 6000 years. As seen in Figure 1, annual global CO2 emissions in 2022 were more than 40 billion tons with fossil fuel burning amounting to more than 37 billion tons [3]. Even though part of the emissions is absorbed by forests and oceans, there is a net increase in atmospheric CO2 levels [4]. Figure 2 shows the CO2 levels for the past 60 years. There are some studies to indicate maximum CO2 levels should be brought down to 350 ppm to maintain ecological balance [5] [6].
CO2 is a greenhouse gas that traps the heat within the earth’s atmosphere leading to an increase in average global temperatures. Rising CO2 levels are the leading cause of climate change with effects ranging from extreme droughts, heat, wildfires, erratic rainfalls, flooding, and other climactic tipping points. The main causes of CO2 emissions are the burning of fossil fuels and deforestation.
Global CO2 Emissions
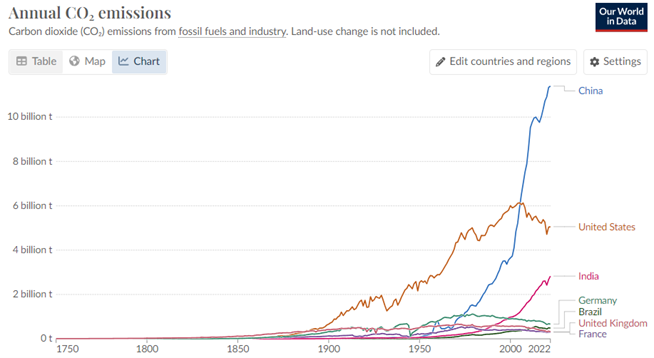
Figure 3 shows the top countries with high annual CO2 emissions. China leads the pack with 11.4 billion tons of CO2 emissions in 2022. China contributes 30.68% of the global annual CO2 emissions due to fossil fuels. Annual CO2 emissions of the US have been declining since 2006, but it is still in second place at 5.06 billion tons (13.61%). India comes third at 2.83 billion tons of CO2 (7.62%). EU as a whole emits 2.76 billion tons of CO2 (not shown in Figure 3) (7.43%). The top four contributions amount to almost 60% of the total emissions. The emissions of the rest of the countries are much lower.
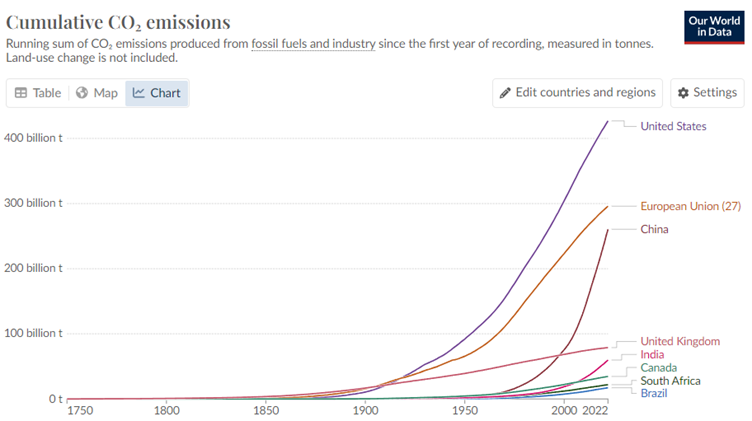
The current atmospheric CO2 levels are a result of the cumulative effects of CO2 emissions. Since 1750, around 1.73 trillion tons of CO2 have been emitted. The cumulative CO2 emissions of the top countries are shown in Figure 4. The figure provides each country’s historic contribution. From Figure 4, it is obvious that despite the current reduction, the US with 426.91 billion tons has been the biggest contributor (almost 25%) to overall global CO2 levels. It is followed by the EU, China, UK. India is in fifth place at 59.74 billion tons contributing just 3.5%.
CO2 Emissions Breakup
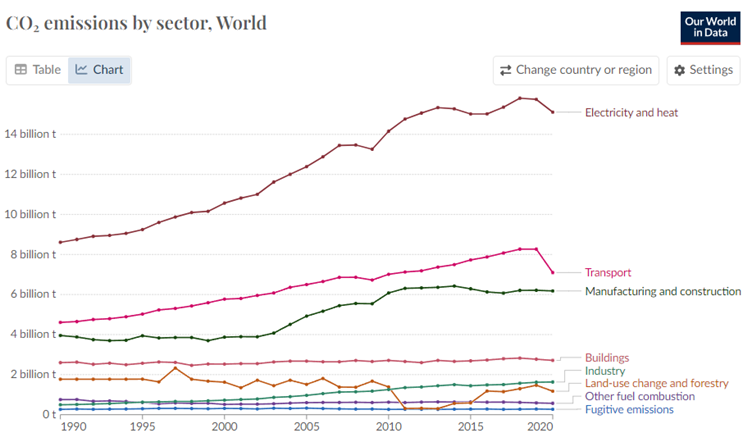
Next, we look at the sector-wise breakdown of annual CO2 emissions, shown in Figure 5 till 2020. Electricity and heat generation contribute the most to CO2 emissions at 15.11 billion tons, which amounts to 43% of 2020 total emissions [7]. Transportation comes second with 7.1 billion tons (actual emissions will be higher considering 2020 was a pandemic year) at 20%. Manufacturing and construction round up the third place at 17.6% with 6.18 billion tons. Thus, 80% of global CO2 emissions occur due to these industries.
Global Greenhouse Emissions
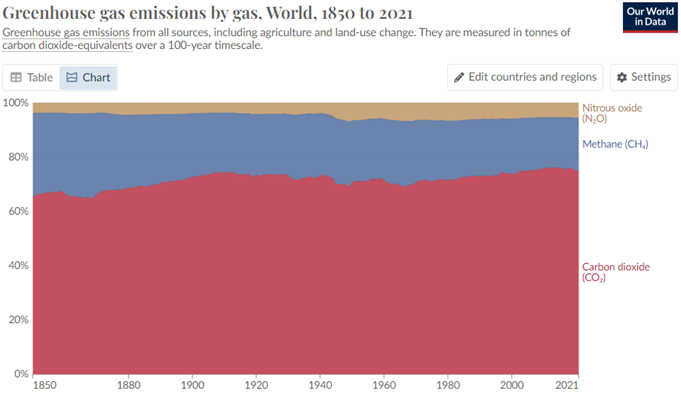
Even though CO2 plays a major role in global warming, there are other gases – methane, nitrous oxide, and trace gases – which contribute to the greenhouse effect. Greenhouse gases are measured in CO2-equivalents (CO2-e) over a 100-year timescale. 54.6 billion tons of CO2-e were emitted in 2021, out of which CO2 emissions were 41.14 billion tons (including land-use change) [8]. Figure 6 shows the effect of different gases on global warming. 75% of the effect is caused by CO2, 19% due to methane (CH4) and 4% by nitrous oxide (N2O). That is why the focus is mainly on CO2 emission when it comes to the greenhouse effect. Methane is short-lived with an average life of 12 years in the atmosphere, but it causes 28 times the amount of warming as compared to CO2. N2O has a longer life of 121 years and is also more potent at 265 times warming potential. Compared to these, CO2 stays in the atmosphere for hundreds of years. Most CH4 emissions are due to livestock and fugitive emissions (venting & leakage) from fossil fuel infrastructure. N2O emissions mainly occur from agricultural activities.
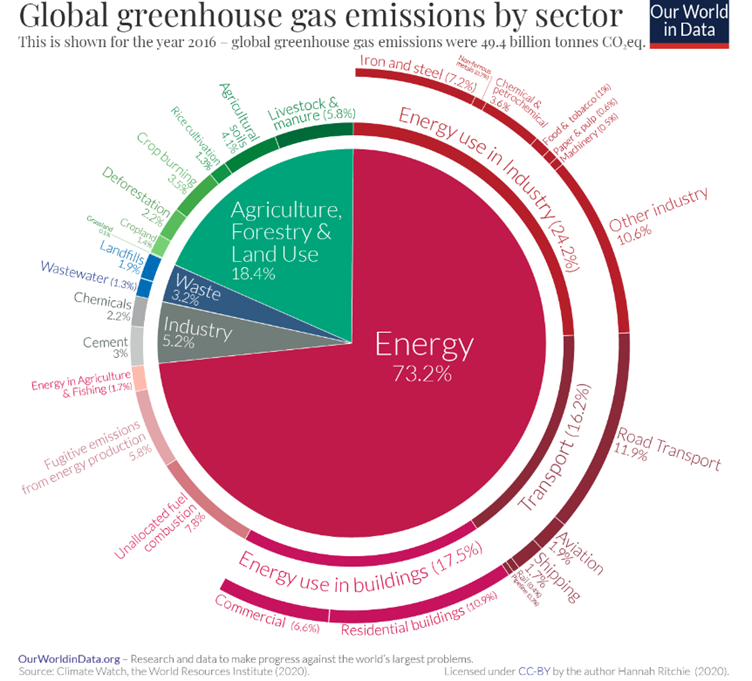
Even though dated, Figure 7 gives a good overview of the sector-wise breakup of greenhouse gas emissions [9] in 2016. As expected, most of the emissions are due to energy usage in industries, transportation, and buildings. The breakup within these sectors is also shown.
Mitigation
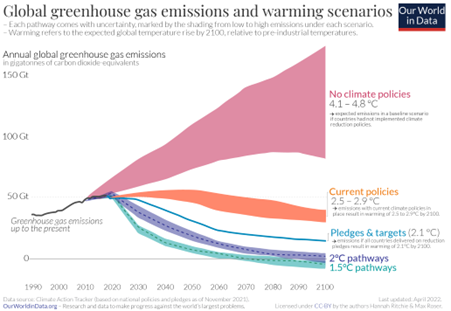
Currently, global-scale CO2 removal from the atmosphere needs to be implemented to prevent climate runaway effects like glacier melting, sea level rise, abnormal rain and drought conditions, etc. Based on different mechanisms, the overall rise in global average temperature is shown in Figure 8. For 2C pathways, immediate action needs to be taken for global-scale CO2 removal from the atmosphere. The first step is to ensure the annual greenhouse emissions of roughly 50 billion tons are eliminated. Thereafter, accumulated emissions need to be taken care of to reduce the overall atmospheric CO2 levels. Thus, any carbon removal technique needs to be operable at a large scale to be even remotely effective in this global operation.